As the data manipulation is being done on the Insight server, the configuration in the Studio is straightforward.
...
We need to create a task to pull the spatial data from the Insight database view into a Shape file to display the information on the map. It could just as equally be a MapInfo file.

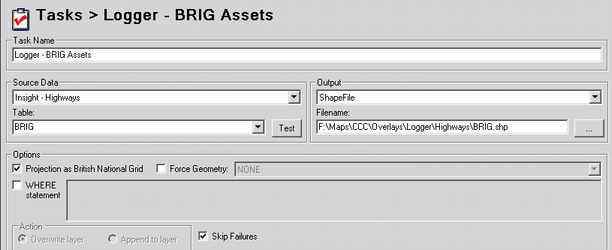
The resulting file name must match that which you have defined in your .map file [without the .shp extension].
...
Right click on the Faults node and select to Add a new layer.

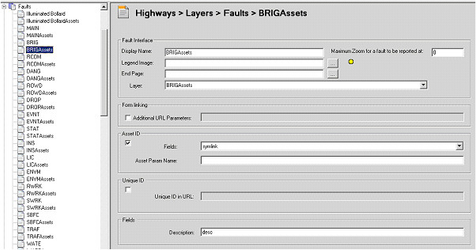
The Logger configuration references the BRIGAssets layer configured in the .map file as per the above.
Fault Interface
Display Name
This is the name to display for the link to the e-form.
...
This is the layer that is used to plot information on the map about the particular fault type. If you are using an Asset ID it shows the locations of the asset e.g. street lights. This could also be used to show previously reported faults.
Asset ID
Fields
Here we select the field that represents the Asset ID to be passed to the e-form for fault reporting. In this case it needs to be symlink which was the unique identifier for both asset types.
Fields
Description
If there is a field that you would like to use as a Description field then enter the name here. In this example we have a field called Desc which holds the description of the Bridge asset.
...