...
- Create a Layer Group for your Police data e.g. Crime
- Create the individual Layers for each of the Police data you wish to display.
| Note |
|---|
The following examples are using the LAYER names as per the snippets in the Update .MAP for Police Layers topic. |
My House
Recent Crime Statistics

This extracts data from the neighbourhood_crimes data and details the recent crime statistics around the selected address.
Police Neighbourhood

This extracts data from the neighbourhood_boundaries data and details which displays which Police Neighbourhood the selected address is in.
Police Team
In order to add a layer for Police Team you must first have created and run the task to Create Police Team information which creates the police_neighb_teams table.
Then you can add the Layer.

This displays the Police Team for the selected address location.
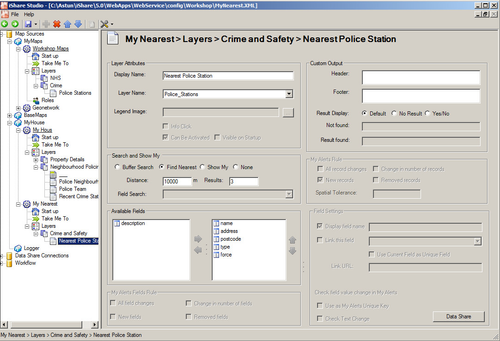
My Nearest
Here you may wish to Find My Nearest Police Station. In our example .MAP Layer for police_stations this extracts the information from the neighbourhood_locations table.
My Maps / iShare GIS
For My Maps/iShareGIS the police stations/neighbourhood_locations and street crime dataset (with clustering) as above works well.