QGIS-07 3.28: QGIS Geo Processing
7. QGIS Geo Processing
This module introduces a few of the common QGIS vector processing functions. In most cases, processes take as input one or more vector layers and create a new vector layer as output. Use the search box in the bottom left of the QGIS interface to find processes - they are all in the Processing Toolbox as well, and some have their own menu options.
7.1. Create buffer
Create a new QGIS project and save it in the QGIS Training > Essentials folder
Open the nat_parks_england and railway_naptan layers
In the nat_parks_england layer, Select the Lake District national park (check in the Attribute Table if you are not sure which one this is)
Find the Buffer tool by searching in the Search box, and create a 10km buffer round the Lake District National park - be sure to check Selected features only, and create a temporary layer
Use the Select by location process to find out how many railway stations are within the Buffered layer - look at the attribute table for railway stations to get the count
7.2. Create centroids and find nearest
Open the boundaryline.county_region layer from the Postgres training database
Find the Centroids process, and use it to create a new layer of the centroids (the centre point) of each county
Use the Join Attributes by Nearest process to add the details of the nearest railway station to each centroid feature
Look at the attribute table for the Centroids layer to check the result, and add a label showing the name of the nearest station to the centroids layer
7.3. Visualise railway station density
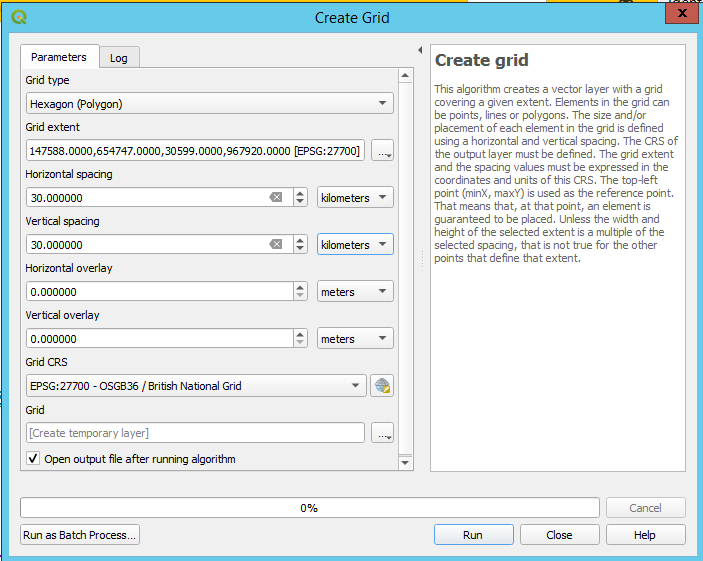
Using the Create grid tool, create a hexagon grid to cover the extent of the railway stations layer.
Zoom to the extent of the railway stations layer
Create a 30km hex grid for the extents of the layer, with settings as shown in the screenshot - to get Grid extent, click the three dots to the right of the field and use Calculate from Layer
Get the number of stations in each hexagon by using Count points in polygon, and check the attribute table for the results
If you have time and want to try some styling, create an appropriate Graduated style for the grid layer, so that areas with higher concentrations of stations are shown darker than those with no or few stations, and add a label showing how many stations there are in each hexagon