Enable iShare GIS Predefined Site Report Plugin
- Kim Stimpson
Overview
The Predefined Site Report plugin for iShare GIS allows a user to create a Report based on a pre-defined set of Layers and fields in those Layers. The Report can be printed or, if using a Chrome browser, saved as a PDF.
The following is a list of the current Plugins available for iShare GIS.
| Plugin | Definition |
|---|---|
| Drilldown | Allows a user to draw a Polygon on the map and then Drill down to display the details for the configured Layers in the Information Browser. From the Information Browser the Results may then be exported. A typical example would be for Local Authority Planners to be able to return information on all planning constraints (often over 15 individual layers) data even without the user needing to remember to have all the layers visible in the map. |
| Site Report | Allows a user to create a Report detailing all of the Active layers enabled for Info Click in the current Map Window extents together with a map. This Report may then be printed, or if using Chrome as your browser saved to PDF. |
| Predefined Site Report | Allows a user to select an area of interest over which to create a Report on any number of predefined Layers within a single Map Source (Profile) within iShare GIS, without the user needing to remember to have all the layers visible in the map. This Report may then be printed, or if using Chrome as your browser saved to PDF. |
| Feedback | Allows a user to provide Feedback in the form or an email using their default email client. The To, CC, Subject & Body may be auto populated. |
Setting the scene
This Predefined Site Report may be used to report on any number of Layers within a single Map Source (Profile) within iShare GIS. You can configure customised Predefined Site Reports for various Map Sources (Profiles).
Here we are using the Predefined Site Report to report on the schools in the area and have included the Name of the school, the Gender and the Capacity and returned the results sorted by descending Capacity. Users can then use one of the Select & Measure tools to identify a specific area they are interested in and then click the Predefined Site Report button. If no selection has been made when the button is clicked the current map window extents are used.
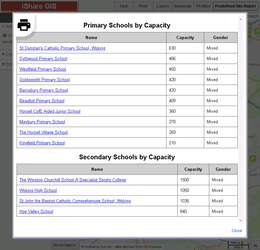
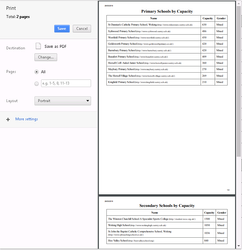
Now you can either choose to print the report by clicking the Print the Report button at the top right of the page or click Close to return to iShare GIS . If you are using Chrome as your browser then, as well as the available Printers, you will be able to save this report as a PDF file e.g.
Layers that have been included in the Predefined Site Report do not have to be displayed in your Map Categories or be visible on the map, for them to appear in the report.
Steps for enabling the “Predefined Site Report” button
Step 1 - Download the Plugin
Download the iShareGIS-PredefinedSiteReport plugin.
Step 2 - Copy Plugin to custom\plugins folder
In order to prevent your custom plugins being lost when you upgrade your version of iShare GIS, they should be kept under the \web\custom\plugins folder.
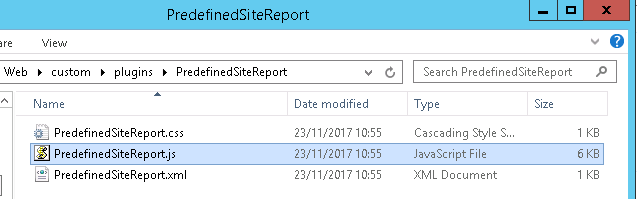
Create a PredefinedSiteReport folder under this folder and add the downloaded PredefinedSiteReport files e.g.
D:\Astun\iShareGIS\n.n\WebApps\Web\custom\plugins\PredefinedSiteReport
Step 3 - Add to list of Plugins
Navigate up one folder level to the \custom\plugins folder. This folder must contain at least one XML file defining however many custom plugins are required. If this is the first plugin you are adding then you will need to create this file, otherwise you just need to add a new entry for the PredefinedSiteReport plugin. The file should contain the following:
<PluginView>
  <Plugin>PredefinedSiteReport</Plugin>
</PluginView>
For each custom plugin you would need to add a new <Plugin> entry.
This <Plugin> entry needs to match exactly the folder name you created in Step 2.
There is a CustomPlugins.xml file provided in the .zip file which you could copy if you wish.
Save your changes.
The plugin buttons are loaded in the order that the plugins are specified in the XML file.
Step 4 - Enable Plugin for a Map Source
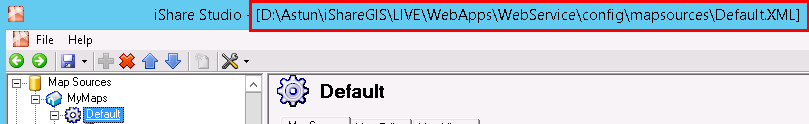
In order for iShare GIS to load your custom plugins, you will need to edit any Map Source XML where you wish the plugins to be available. To find the MapSource.XML you need to edit click on the node for the Map Source in Studio and the path will be displayed in the caption (see outlined in red below).
Edit the MapSource.xml with a Text Editor and scroll to the bottom of the Layers section. You will need to manually add a PluginViews section (if it doesn't already exist), pointing to both the default iShareGIS.xml and your CustomPlugins.xml file e.g.
<MapSource version="200" guid="012345678-9abc-def0-1234-56789abcdef">
  <Layers>
    ...
  </Layers>
  <PluginViews>
    <PluginView>plugins/iShareGIS</PluginView>
	<PluginView>custom/plugins/CustomPlugins</PluginView>
  </PluginViews>
</MapSource>
The PluginView value (custom/plugins/CustomPlugins) is the path the to XML file (without the .xml extension) which will be read in and added to iShare GIS for this Map Source.
Save your changes.
Step 5 - Customise the Report
The report can be customised by changing the definition at the top of the Predefined SiteReport.js file.
The Map Source & Layers are defined using a custom JavaScript object. In our example below you can see we have added our Default Map Source with two Layers Primary_Schools_OGC and Secondary_Schools_OGC.
Please note the comma after the first Layer; this is required for all but the final Layer. The same applies to the MapSource entry if you add more than one Map Source.
Also if you don't have an orderBy entry then you need to remove the comma following the ] on the previous line.
The following is the layers extract from the Predefined SiteReport.js that was used to create the above example.
	var layers = {
		"mapsources/Default" : {
			"Primary_Schools_OGC" : {
				displayName: "Primary Schools by Capacity",
				fields: [
					{ name: "establishment_name", displayName: "Name" },
					{ name: "capacity_numeric", displayName: "Capacity" },
					{ name: "gender_name", displayName: "Gender" }
				],
				orderBy: {
					field: "capacity_numeric",
					sortOrder: "desc"
				}
			},
			"Secondary_Schools_OGC": {
				displayName: "Secondary Schools",
				fields: [
					{ name: "establishment_name", displayName: "Name" },
					{ name: "capacity_numeric", displayName: "Capacity" },
					{ name: "gender_name", displayName: "Gender" }
				],
				orderBy: {
					field: "capacity_numeric",
					sortOrder: "desc"
				}
			}
		}
	};
Each layers definition contains the following properties which we have based on the above example:
| layers | This defines the MapSource, Layers and Fields that you wish to include for the Layer together with an optional OrderBy property. | |
| "mapsource/Default" | Full MapSource Name as shown in Studio in the Map Sources > My Maps > MapSource Name field. As you will be able to see from the supplied JS you can add more than one MapSource property. You would still need to perform Step 4 above for each MapSource and the Report will only show the Layers for the Current Map Source selected in iShare GIS. | 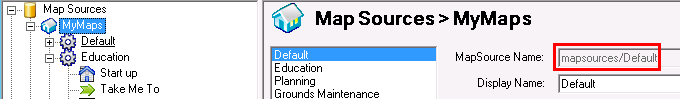 |
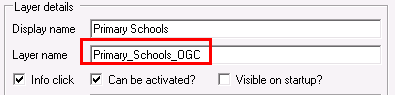
| "Primary_SchoolsOGC" | The Layer name as shown in Studio layer definition. |
|
| displayName: "Name" | The name for the layer as shown in the report - optional | |
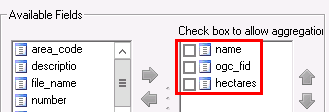
| fields | A list of the fields to show in the report. You can add as manay fields as you like with the only restriction being that any field added must have been added to the output of the Layer in Studio i.e. appears in the right-hand column under the list of Available Fields. | OGC Layers
|
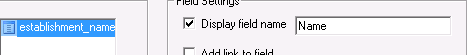
| name: "establishment_name" | The field name to display. Note: For Classic Layers, which don't return the field name you need to use the Display field name in Studio here. You can still use a different displayName if required. | Classic Layers
|
| displayName: "Name | The text to display for the field heading in the report | |
| orderBy | Allows you to order the results - optional | |
| field: "capacity_numeric" | The field name of the field to order the results by. Again for Classic Layers this will need to be the Display field name. | |
| sortOrder: "desc" | The direction of the sort, either "asc" or "desc" (ascending if not specified). | |
Save your changes.
Step 6 - Change Plugin button Text & Tooltip - Optional
This step is only required if you wish to change the default text for the Button and Tooltip e.g.
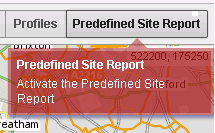
Edit the PredefinedSiteRpoert.js and scroll to the bottom of the file. If you want to change the Button label or Tool Tip for the button then you will need to change the text and tooltip / tooltipTitle entries respectively.
Astun.JS.Plugins.installButton(
	{
		name: 'predefinedSiteReport',
		type: 'modaldialog',
		dialog: Astun.JS.Plugins.dialogs.predefinedSiteReportOutput,
		hideOnEmptyDialog: false,
		text: 'Predefined Site Report',
		tooltip: 'Activate the Predefined Site Report',
		tooltipTitle: 'Predefined Site Report'
	}
);
| text | This is the text that appears on the button |
| tooltip | This is the text that appears in the tooltip body when you hover over the button |
| tooltipTitle | This is the text that appear in the tooltip title when you hover over the button |
Save your changes.
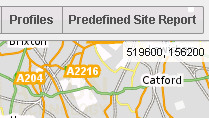
Step 7 - Change Plugin button position - Optional
The default for the PredefinedSiteReport plugin is to display the button on the right hand side of the toolbar. If you wish this to appear on the left you will need to edit the PredefinedSiteReport.xml file and change the Category entry from "standard" to "advanced" e.g.
<Plugin>
	<Name>PredefinedSiteReport</Name>
	<Description>Activate the Predefined Site Report</Description>
	<Category>advanced</Category>
</Plugin>
Save your changes.
Step 8 - Test the Plugin
The PredefinedSiteReport plugin should now be configured.
You will need to Clear the iShare cache and reload the Config, before the “Predefined Site Report” button is displayed. If you subsequenty make configuration changes to the Plugin then you will also need to perform these actions before your changes take effect.